JavaScript Graphics
Graphic Libraries
JavaScript libraries to use for both Artificial Intelligence graphs and other charts:
Plotly.js
Plotly.js is a charting library that comes with over 40 chart types, 3D charts, statistical graphs, and SVG maps.
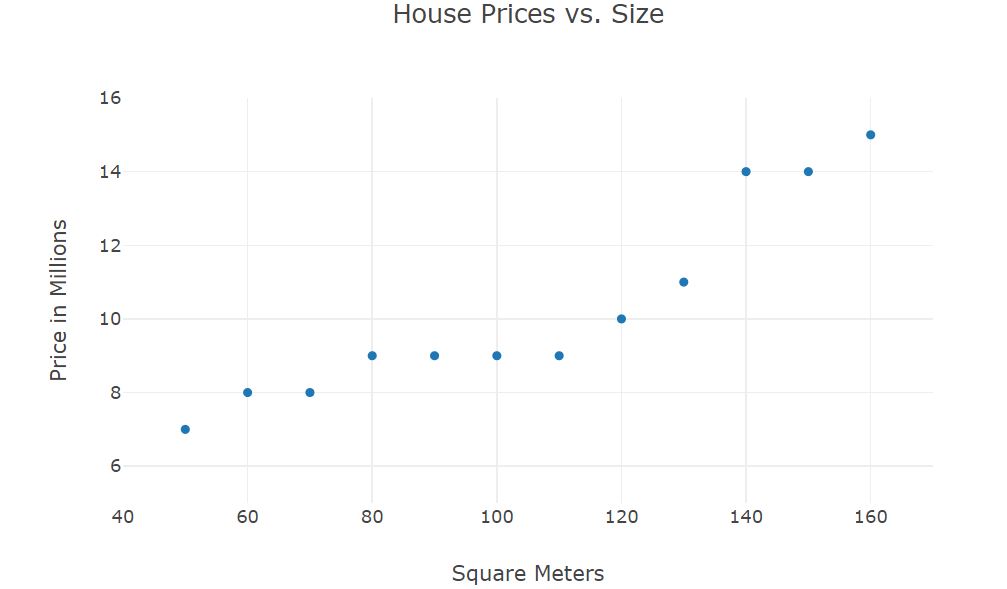
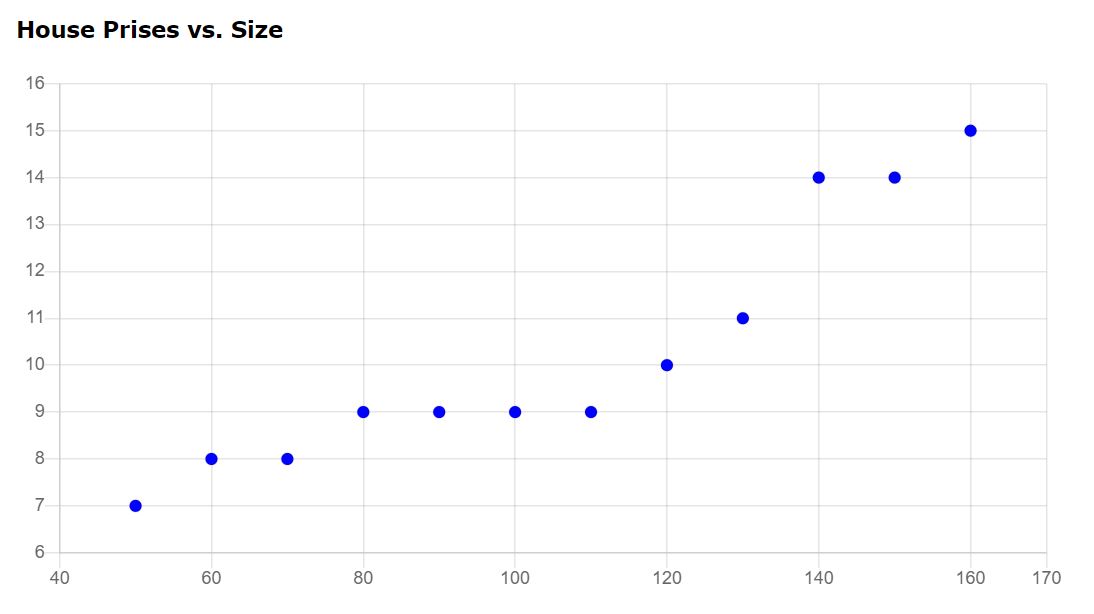
Chart.js
Chart.js comes with many built-in chart types:
- Scatter
- Line
- Bar
- Radar
- Pie and Doughnut
- Polar Area
- Bubble
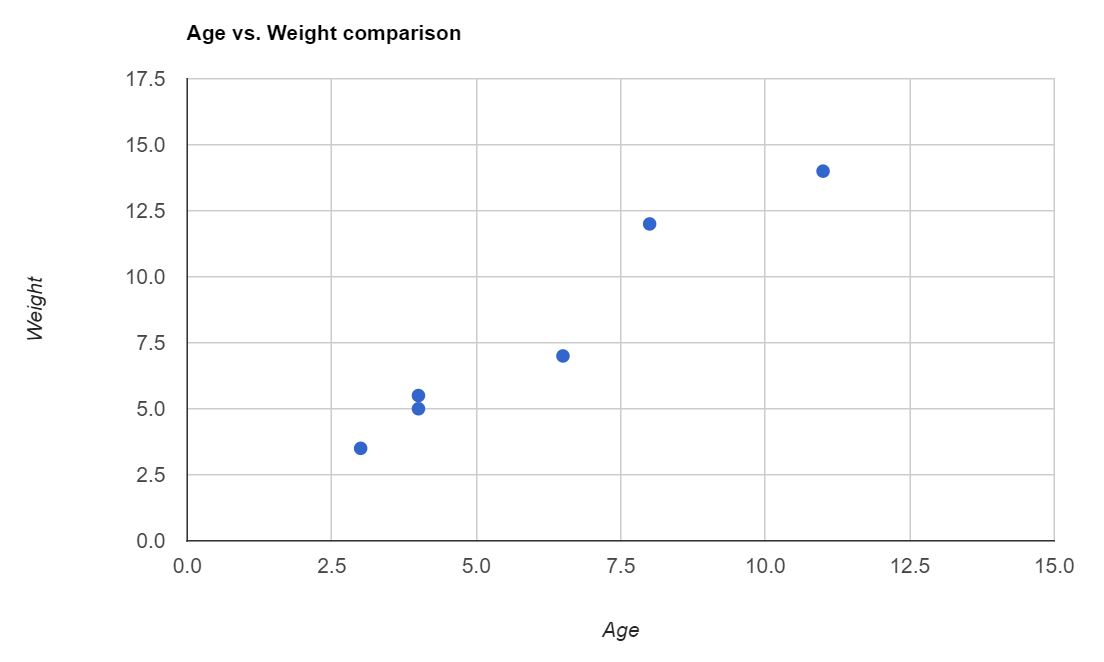
Google Chart
From simple line charts to complex tree maps, Google Chart provides a number of built-in chart types:
- Scatter Chart
- Line Chart
- Bar / Column Chart
- Area Chart
- Pie Chart
- Donut Chart
- Org Chart
- Map / Geo Chart